Shop Talk – Randomness in Board Games
Post Series: Shop Talk
- 1.Shop Talk – Area Control
- 2.Shop Talk Movement Patterns
- 3.Shop Talk – Randomness in Board Games
- 4.Shop Talk – Iconography
Randomness in board games is a hallmark of Ameritrash games. Some Eurogamers won’t play games with elements of randomness because it is believed that it makes sill useless. If implemented poorly, they are correct. So what is it an how does it work? Randomness in board games introduces an element of chance that we potentially see in the real world every day. But your game shouldn’t let randomness trump core strategy or make effort useless. This article accompanies our video on our YouTube channel as well as our audio podcast on the Boomer Radio Network which you can find on the site, on iTunes or on Stitcher.
You need to find a good middle where the randomness isn’t the entire game. In mainstream games sometimes there can be no randomness such as Chess and minimal randomness such as in Monopoly. The only real randomness is how far you get to move on your turn. A game with more randomness, perhaps to its detriment, is Risk. Where combat is so dumbed down it’s really a die roll. All the way to games that are entirely dependent on randomness such as Craps and Roulette.
Basically any time you have coin flips, dice, a shuffled deck of cards (as opposed to a stacked one), or you are drawing something blindly from a bag, you have randomness of some type in your game. Even in games like Catan there is randomness on which resources will be collected on a turn and when the Robber moves. Even Role Playing Games are full of randomness. Any time you roll a Hit Die, roll character skill feats and ability checks, you are introducing randomness to a game.
In some cases this makes perfect sense. In the game I’m developing now From The Sea, hits in combat have an element of randomness but it makes sense. When you consider the circumstances, guns often had inconsistent powder loads, the guns could not be aimed with precision, your ship is moving, the target ship is moving, wind, weather… Randomness played a big role in landing a hit on an enemy ship in the Age of Sail.
The thing you have to understand, is that randomness it all about Probability and Statistics. Let’s examine the random elements and how they are used in, and can affect games and how
Probability and Statistics
Basic Probabilities
First a quick intro to probability. Probability is the chance that a specific outcome will occur from a set of events. It is usually expressed as a X in Y or as a percentage. For example, when flipping a fair coin, you have a 1 in 2 change of getting heads, or 50% . The percentages are calculated directly from the X in Y as X divided by Y or X/Y. X is the number of specific outcomes you are after, and Y is the total possible outcomes. For our coin example, we have 1 specific outcome, and 2 possible outcomes. or 1/2 and 1 divided by 2 is .5 or 50%. If this was dice, and we had a six sided die, most often expressed as a D6, the chance of getting any one specific number, say 3, would be 1 in 6, or 1/6 or 16.6%. The chance of getting an even number on a D6 is 3 in 6 or 3/6 (reduced to 1/2) or 50% .
All probability works like this. Cards are X in Y where X is the number of outcomes you are after and Y is the number of cards in the deck. If you are playing Magic The Gathering, and you have 4 Fireball’s in the deck, you have a 4 in 60 or 4/60 (1/15 when reduced) or 6.6% chance of drawing one of those cards. Percentages of not drawing one of those is just subtracting the chance that you will from 100%. 100% – 6.6% = 93.4% that you will draw something that is not a Fireball.
Independent and Dependent Probability
There is a ‘law’ in probability called The Gambler’s Fallacy. It’s most often seen in roulette because it’s obvious. I’m sure you’ve all seen one of the Roulette history boards pictured here.

Roulette History Board
They show the recent history of numbers that have landed on the wheel. People often look at these and say “Well, 8 hasn’t come up in a while, it’s due.” This is complete nonsense. This is because one spin of the wheel does not affect the one the next one, and it not affected by the one prior to it. They are completely independent events. This is Independent Probability at its finest.
Dependent probability is where the previous event will affect the probability of the next event. Drawing cubes from a bag is a perfect example of this. If we were playing Clank! and we had 5 cubes of each color, Blue, Green, Red and Yellow, and we tossed in 5 Black cubes for the Dragon we would have 25 cubes in the bag. In this state, each color has a 5 in 25 or 5/25 (1/5 reduced) or 20% chance of being drawn. But if we draw a cube, say a Black one, and leave it out of the bag, it changes the state of the cubes in the bag. We now have a 4 in 24 chance of drawing a black one 4/24 (1/6 reduced) or 16.6%. But We have a 5 in 24 5/24 or 20.8% of drawing a particular other color and an 83.4% chance of drawing a non-black cube. Removing that first black cube from the bag, changed the probability of future draws.
Gaussian Distribution & The Empirical Rule
Gaussian Distribution sounds ominous but it’s just a fancy (and official) name for Normal Distribution, or The Bell Curve. In gaming, this is most often used when discussing the probability of dice and particular rolls coming up. This is created when you roll multiple dice. The number in the middle of the curve, called the Mean, comes up more often because there are more combinations of dice that add up to that number than there are the numbers at the ends of the curve.
For example, with 3D6, the Mean is 10.5. (10 or 11 come up about equally). This is because with 3D6 there are more combinations that add up to 10 or 11 than there are that add up to 3 or 18. To get 3, you must roll a 1-1-1, and to get 18 it must be a 6-6-6. No other combination produces those numbers. But to produce 10 for example, you can have 6-3-1, 6-2-2, 6-1-3, 5-2-3, 5-3-2, 5-1-4, 5-4-1, etc. So 10 comes up more frequently than 3 or 18.
There is also a part of the Gaussian Distribution that tells us how many of our results fall within a specific range of the Mean. That specific range is called a Standard Deviation. So when you use a Standard Deviation measurement you can determine how many of your results fall in that range. There is an easy way to remember this called The Empirical Rule or The 68-95-99.7 rule. Have a look at this diagram.
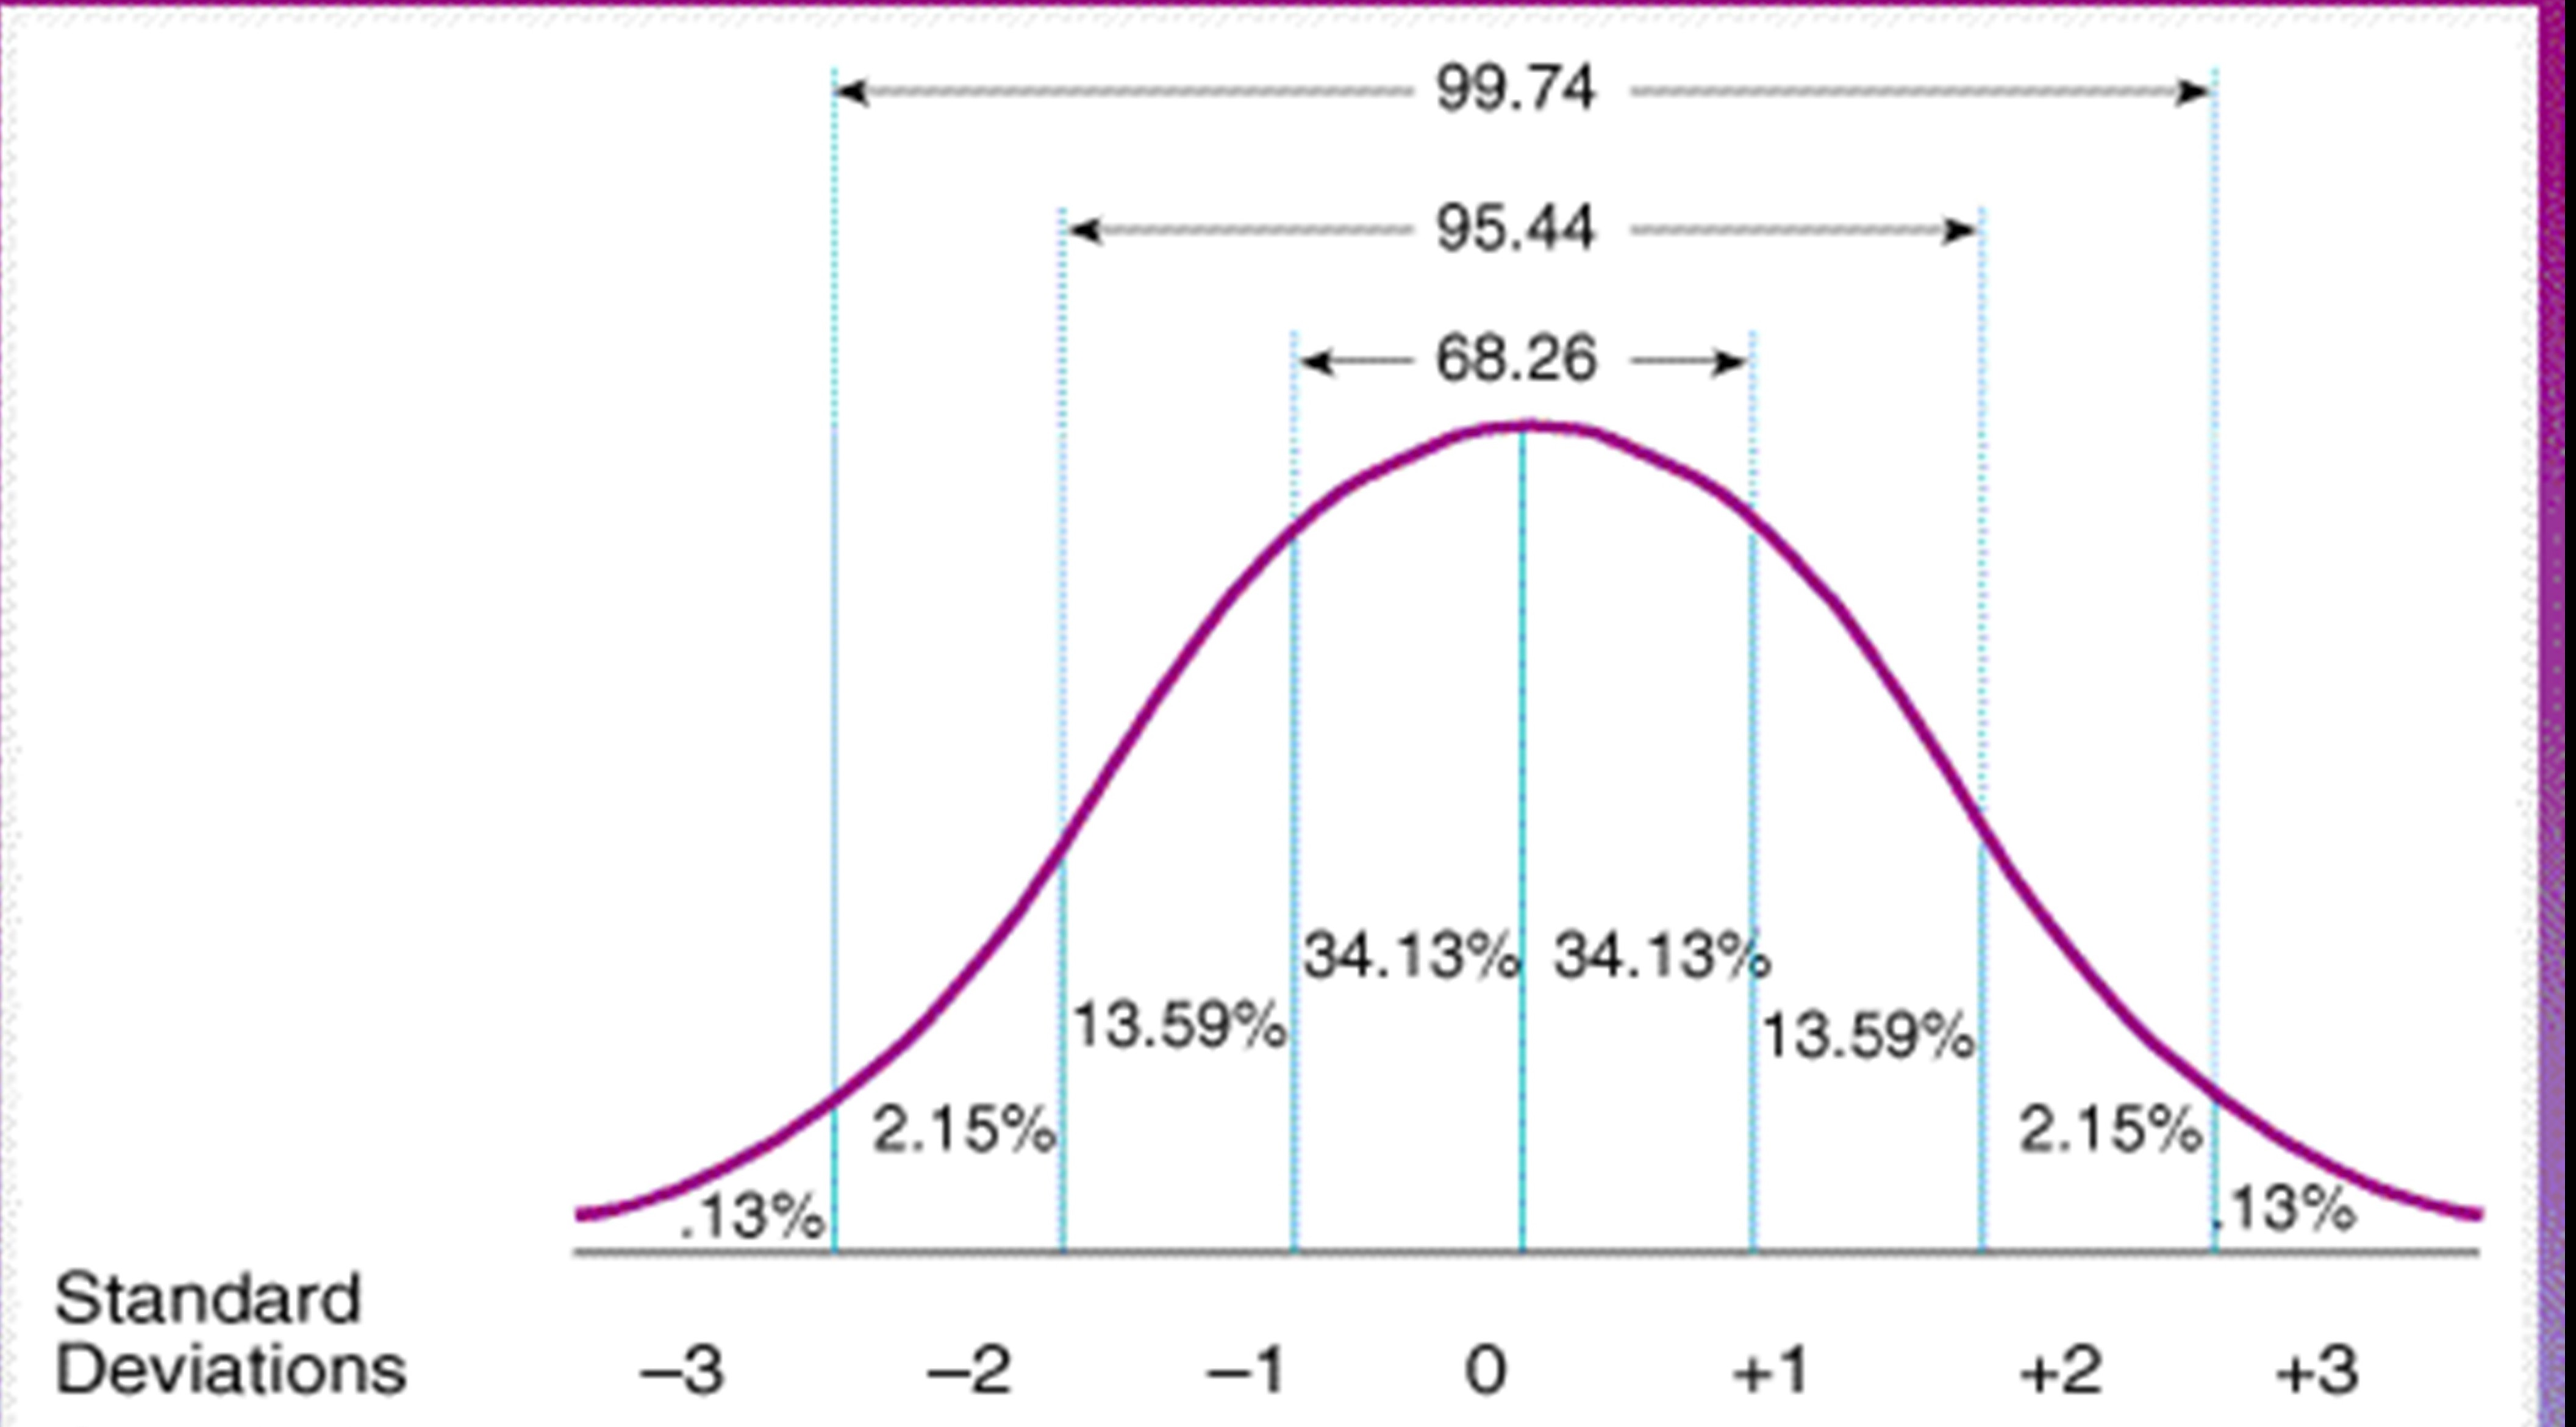
Normal Distribution Diagram
The center is the mean at the 0 point which is where we start counting from. The two first lines to the right and left of the Mean are 1 Standard Deviation, the next two are 2 Standard Deviations and the 3rd set are 3 Standard deviations (SD) away from the Mean. For any defined Mean and Standard deviation, you can tell how many results fall in that range based on the Empirical Rule. 68.26% of the results are within 1 SD of the Mean, 95.44% are within 2 SD of the Mean, and 99.74% of the results are within 3 SD of the Mean.
This is very valuable for determining which types of dice combinations you want to use and how often you want that result to happen. If you want to cover most of the possibilities, you need the numbers you are trying to hit with the dice to be within 3 SDs of the Mean. For example character stats. The average character stat is on the Mean, but you shouldn’t apply bonuses or penalties if the stat falls within 1 SD of the mean. However, if the stat is between 1 and 2 SDs from the mean, you might want to apply mild bonuses or penalties to the character. if it is between 2 and 3 SDs from the mean, you want to apply significant bonuses or penalties, and if falls outside 3 SDs from the mean ( which is only .3% of all results) apply extreme bonuses or penalties.
So you can see that calculating these basic probabilities is not hard, and can be very useful when designing a game and you want to represent a possibility of something happening. There is great free online courses for this kind of thing at: CK12.org: https://www.ck12.org/c/probability/#/ and Kahn Academy: https://www.khanacademy.org/math/precalculus/prob-comb
Coin flips
Coin Flips are an easy way to make a decision between two choices. Every commonly used coin has two sides creating two possible results.
Playing Two UP
There is a base 50/50 on any one coin. If your coin has more than 2 sides, you should check for cheating. Simulating coins can also be done using any dice and taking an Even/Odd approach which should also have a 50/50 chance.
There is a game in Australia that uses 2 coins specifically called Two-Up. The coins are flipped into the air with a paddle, and you bet on the outcome. There are three possible outcomes, Head-Heads, Heads-Tails, Tails-Tails. So you have a 33.3% probability of winning your bet.
Dice
Dice and probability are used so much that I created a Dice Stats tool for myself to check out different combinations and to use as the background for simulating combat in my pirate themed game From The Sea. You can use it too, just go here: http://csdicestats.azurewebsites.net/ and feel free to experiement with different combinations of diece and rolls. You can also do +/- per die, or allow re-rolls of individual dice if they are below a certain value.
Almost every one who has played a game involving dice is familiar with the 6-sided die or D6. Hobby gamers are also normally familiar with polyhedral Dice which is a set of a D4, D6, D8, D10, D12, D20 and Percentile dice or D100 (most often represented by using two D10’s one for 10’s and one for 1’s) They are even using polyhedral dice in elementary schools now to introduce probability and play math games.
The probabilities of any particular number coming up on the common set of dice are:
|
D4 |
D6 |
D8 |
D10 |
D12 |
D20 |
D100 |
|
1/4 |
1/6 |
1/8 |
1/10 |
1/12 |
1/20 |
1/100 |
|
25% |
16.6% |
12.5% |
10% |
8.3% |
5% |
1% |
By now you should be able to figure this out on your own if you weren’t able to already.
Single Die
Interestingly I read on a forum the other day someone asking about the Bell Curve (Normal Distribution) of a D8. Well, a single die does not have a Normal Distribution style bell curve. In fact, it’s flat. This is because for a single die there is always an equal chance of any one number coming up. 3 doesn’t come up more often than 7 or 2 or 8 on a D8. If you roll a D8 10000 times, each value will come up about an equal number of times. Go ahead and try it out at http://csdicestats.azurewebsites.net/
Multiple Dice are what create the Bell Curve that we discussed above when we talked about Gaussian Distributions. The key here though is that if you want a taller narrow curve, you want to use more dice with fewer sides. For example, this chart shows the various ways of rolling up to the value 24.
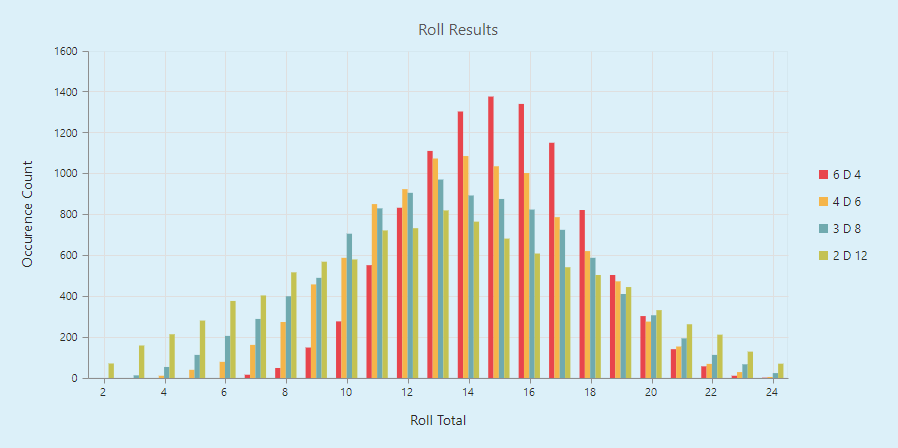
24 Roll Chart
I used http://csdicestats.azurewebsites.net/ to roll 6D4, 4D6, 3D8, and 2D12 respectively as they all can produce 24 at the top end but it gives a good example of how to see the different normal distributions.
You can see that the 6D4 has the tallest and narrowest curve, while the 2D12 has the shortest and widest curve. So if you want results to be more spread out you want 2D12, but if you want a narrow set of results go for the many smaller dice (6D4).
More dice versus re-rolling
This applies here although I did a whole blog post on this topic already. But if you were wondering if it was more advantageous to the players to allow them to re-roll missed dice, or to roll more dice instead, the answer is neither.
If the players roll 4D6, and need a 5 or 6 to hit for example. Their gunnery skill might give them a bonus to hit. You might represent this bonus as adding and additional die making it 5D6 or allowing them to re-roll a single die. In either case, they are still getting 5 chances to roll a 5 or a 6. You can easily test this yourself. Roll 5D6 or roll 4D6, and allow a re-roll of one die, but only use 1 die to do your rolling. Roll that single die 5 times, or roll it, uh… 5 times.
Cards
Decks and probability of each
Decks and Decks are cards are perhaps even more familiar than dice. They are also some of the most straight forward as far as probability goes. It is simply X in Y where X is the number of cards in the deck you are trying to get and Y is the total number of cards in the deck. In a standard 52 card deck there are 4 suits and 13 cards in each suit nor including Jokers. If you are trying to get a Spade for example you have a 13/52 (or equally 1/4 if you think of 1 suit in 4) or 25% chance. For a King, there is a 4 in 52 4/52 or 7.6% chance.
Cards and deck statistics are most relevant to games like Magic: The Gathering. Deck building is a major component of MtG. While it is not a Deck Building game because during play you do not build decks, in Constructed Tournaments, how the deck was built is all about probability. Since you can only have 4 of any one card other than basic lands in the deck, and the decks are normally 60 cards (or more but not less), than you have a 4/60 (1/15 reduced) or 6.6% chance of drawing that particular card. If you have fetch cards like Diabolic Tutor which allows you to search for any card, and you run 4 of those as well, you can increase your chances of getting that card to 13.3%. There are many articles on the probabilities of MtG so I won’t belabor the point here.
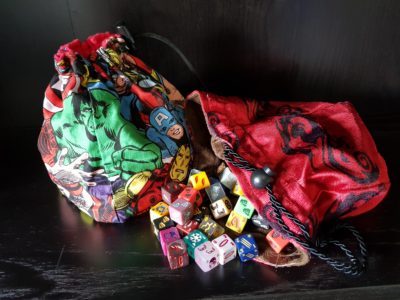
Bags
Dice Bags have become very popular with games like Marvel Dice Masters and Clank!. Bags are a study in Set Probability. As we disused above it is really a X items in a total of Y items in the bag. Our game Rare Roses is like this. You draw roses from the bag to determine what is in the market and available to purchase so you can fill orders. In Clank! you are drawing colored cubes to see who the Dragon is after. The probabilities are ratios of the numbers of target items to the total items. I won’t repeat the discussion here but the section above about Dependent Probability is what we are dealing with.
Decks tell stories, Dice tell outcomes
Really when it comes down to it, you need to do what makes sense for your mechanics and theme. Dice tend to tell outcomes and by themselves are just number generators. While this is fine and is great when combined with character sheets, cards can tell a story based on text and the specific effects that come up when the card is drawn, played or discarded etc. However, if you need varying results with a Normal Distribution, you need dice. Decks of cards are limited when it comes to Normal Distributions because they are basic probability tools. By that same token, bags are a useful tool and can be very thematic. However, they are basic set probability and unless you can create very fine print tend to be about determining a result.
So I encourage you to experiment with the ideas and what you are trying to accomplish. Have a play with the CS Dice Stats Simulator and tune the dice sets in your game for the most efficient way to represent the results. As always, Make Awesome Things!